More Alcoholic, More Caloric, & Less Bitter: Six Years of Craft Beer Trends
Introduction
Equipped with 6,300 beers tested at Oregon BrewLab between 2018 and 2023, I sought to determine the yearly changes on key beer metrics: alcohol (ABV), Calories (cal/12oz) and International Bitterness Units (IBU). Using this dataset, I intend to provide data visualizations for six years of craft beer trends. General market sentiment suggests consumers are purchasing less beer, but data revealing which target metrics persist can provide insights into shifting preferences and offer actionable steps for brewers today.
This winter, while beer production and consumption hit their seasonal lows, I channeled my chemistry background into completing the Google Data Analytics Certificate. Expanding my education is a habit of mine when testing slows down, and this April, I finalized my Capstone Project for the program: “More Alcoholic, More Caloric, & Less Bitter: Six Years of Craft Beer Trends.” What better way to share the findings than by bringing them directly to the brewing community in a blog post?
About the Data Set
The foundation of this analysis is Pacific Northwest-centric data generated from TTB-certified chemist, yours truly, Dana Garves while running beer samples for Oregon BrewLab. Ensuring reliability and precision, the dataset covers Alcolyzer (ABV and Calories) readings from an Anton Paar DMA4500 and International Bitterness Units (IBU) spectrophotometric measurements of humulones. To maintain focus, non-beer samples such as cider, mead, spirits, and kombucha were removed during the cleaning process, leaving a pure look at how beer metrics have changed between 2018 and 2023.
I also want to acknowledge the clear bias here – these samples have been collected from self-selected breweries who choose to do analysis testing, with their motives for testing their brews varying widely. Regardless of their reasons for testing, I wanted to see if this data would tell us a story. In the future I’d like to look at a data set that considers beer styles, and I would also like to see how Non-Alcoholic & Low Alcohol Beers (NALABs) have impacted these results specifically, because they have been included in the dataset, but not singled out. A changelog and raw dataset CSVs for this analysis can be requested from the author.
A changelog and raw dataset CSVs for this analysis can be requested from the author.
Guiding Questions
Before analyzing the data I created my Guiding Questions, or what we call it in science, my hypotheses:
1. How did the average ABV, Calories, and Bitterness change from January 2018 to December 2023?
2. What is the impact of the 2020 Pandemic on ABV and Calorie content within the dataset?
3. Did the average Bitterness (IBUs) in the dataset decrease from January 2018 to December 2023, and is there seasonality in IBU quantities during this timeframe?
4. Which of the three primary metrics (ABV, Calories, or IBUs) exhibited the highest month-over-month variance within the compiled data from January 2018 to December 2023?
Analysis
ABV & Calories: A Classic Pairing
I was delighted to see the trend depicted below between ABV and Calories, because there is a well known relationship between these metrics; “pure alcohol provides approximately 7.1 kilocalories per gram (kcal/g)” [Source]. Unsurprisingly, the 6,302 samples tested over six-years worth of data confirms this strong relationship. The graph below shows that for every 1% increase in ABV, a 12oz beer gains approximately 29 calories.
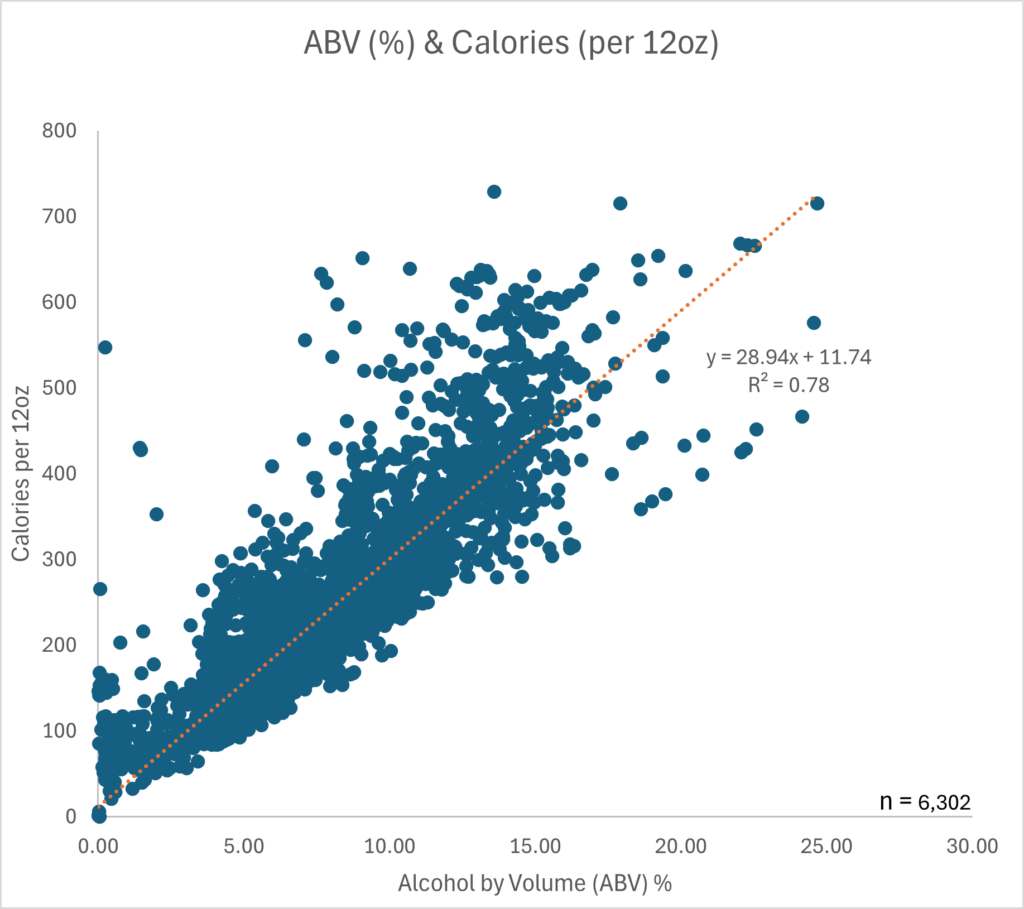
Looking at the R-squared value of 0.78 indicates a decent fit, meaning approximately 78% of the variance in calories can be explained by the alcohol content alone. While the trend is tight, there are significant outliers above the trend line. These represent “heavy” beers (like pastry stouts or hazy IPAs) that contain high amounts of unfermented sugars, lactose, or fruit additions that add calories beyond what the alcohol provides. Note that there is a Significant Vertical Spread: Despite the strong trend, beers with the exact same ABV can vary by hundreds of calories (e.g., at 10% ABV, calorie counts range from roughly 200 to over 600).
Pandemic Impacts and Surprising Trends
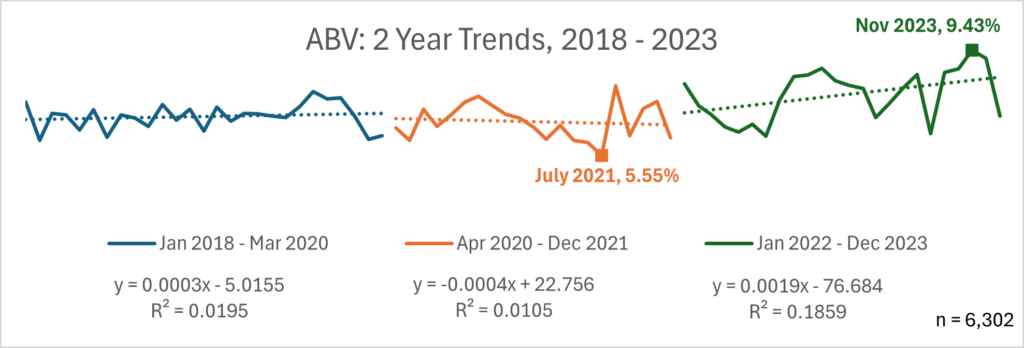
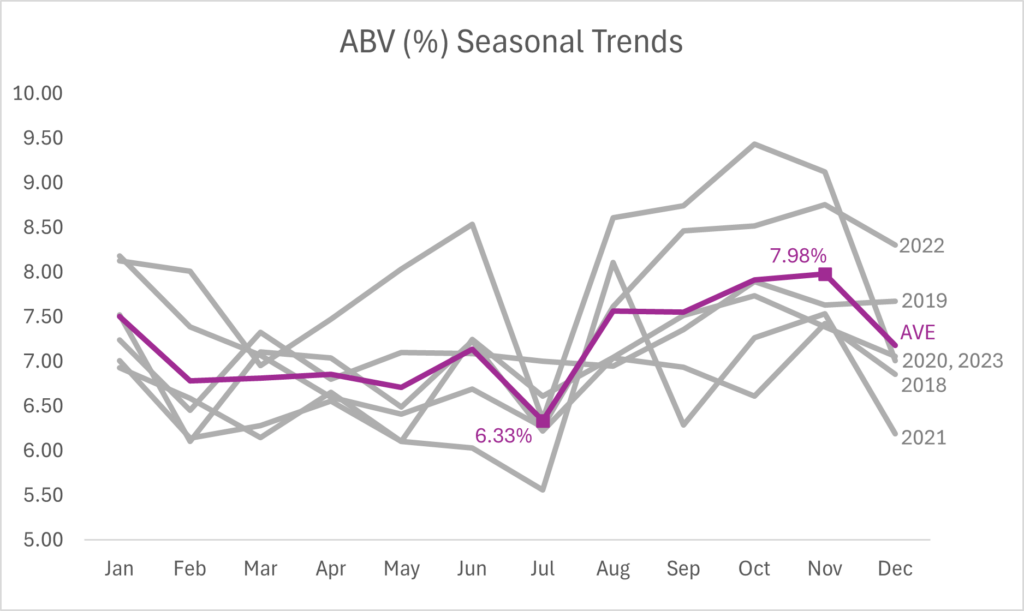
Despite a market heavily leaning toward lower-calorie and lower-alcohol options, average ABV bottomed out at 5.55% in 2021 before surging significantly through 2022 and 2023. Showing a steeper trend upwards in 2022-2023.
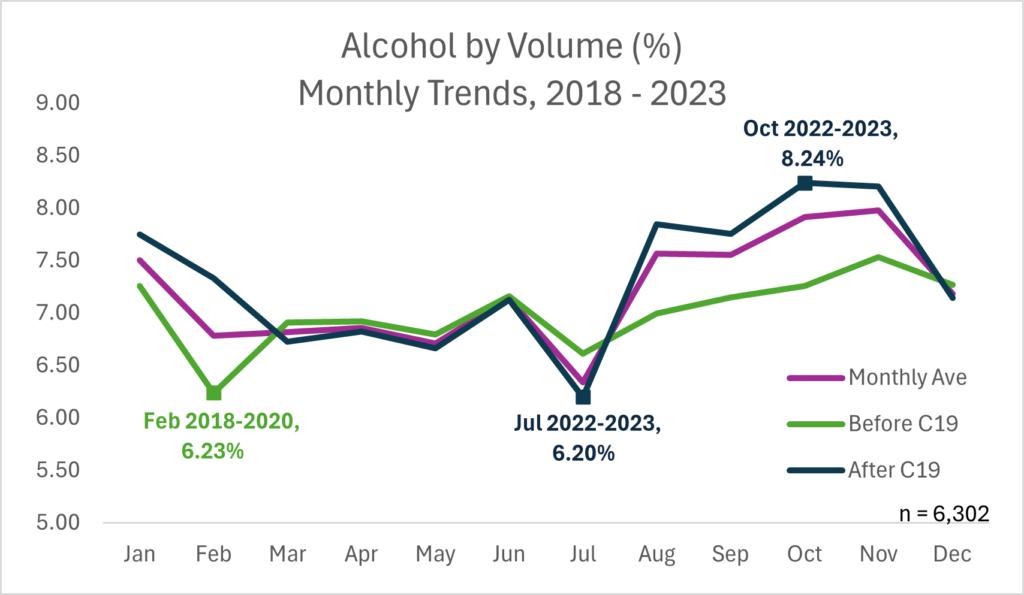
After the pandemic (2022-2023) the summer months saw a drop in ABV, but then a massive swing to extremely high ABVs in the last quarter of the year.
Consequently, caloric averages were consistently higher post-pandemic. July continues to be the lowest Calories over the 6 year period.
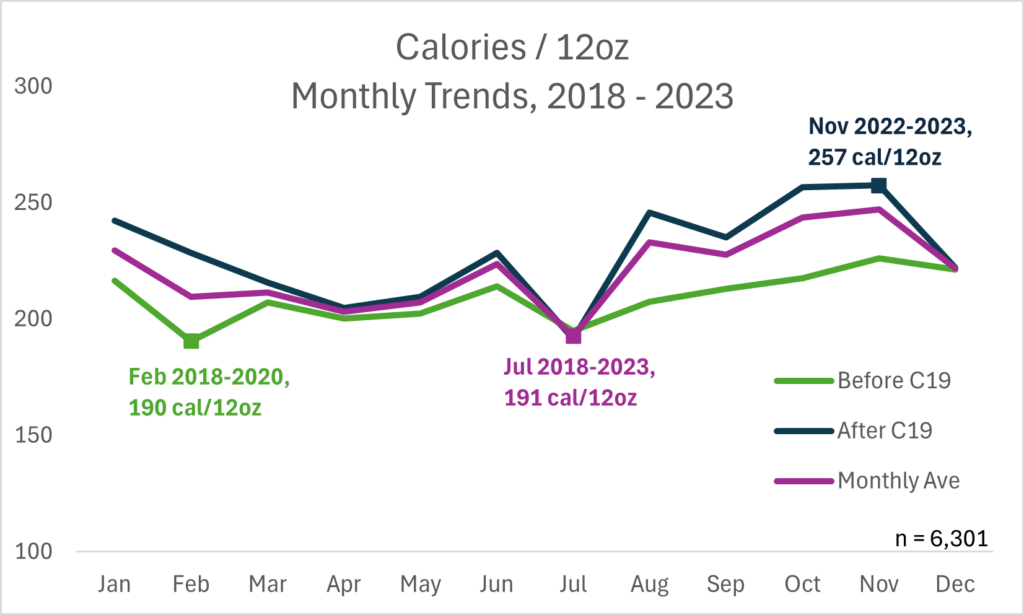
This increase in Calories seems to be increasing, climbing higher over time:
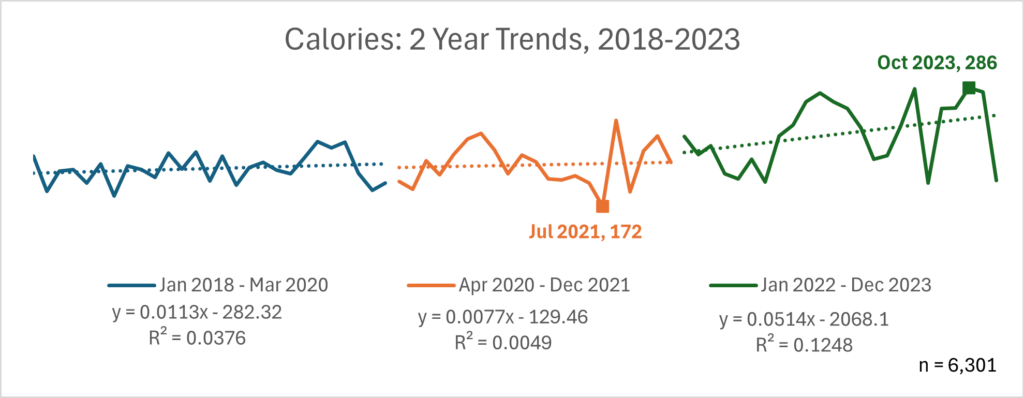
Brewers appear to be increasing caloric content, potentially through adjuncts, despite the linear relationship with ABV discussed previously. This increase became steeper in the years following the pandemic.
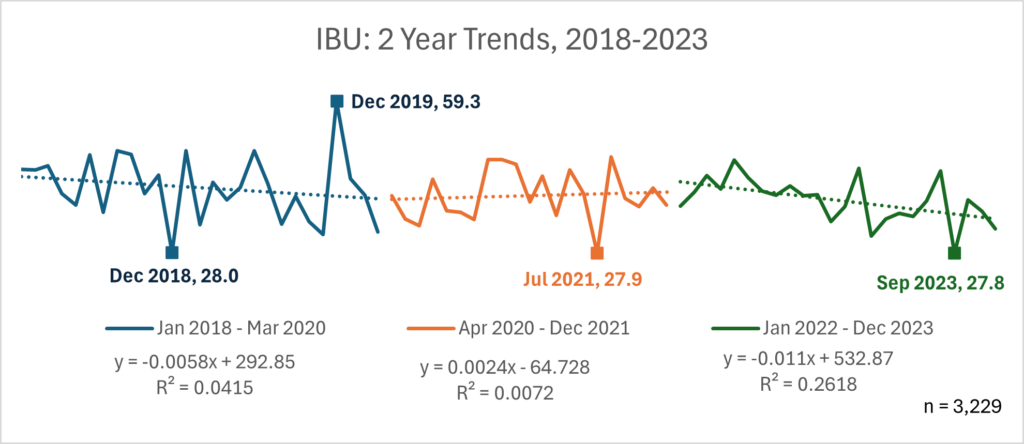
The Bitterness Downward Slope
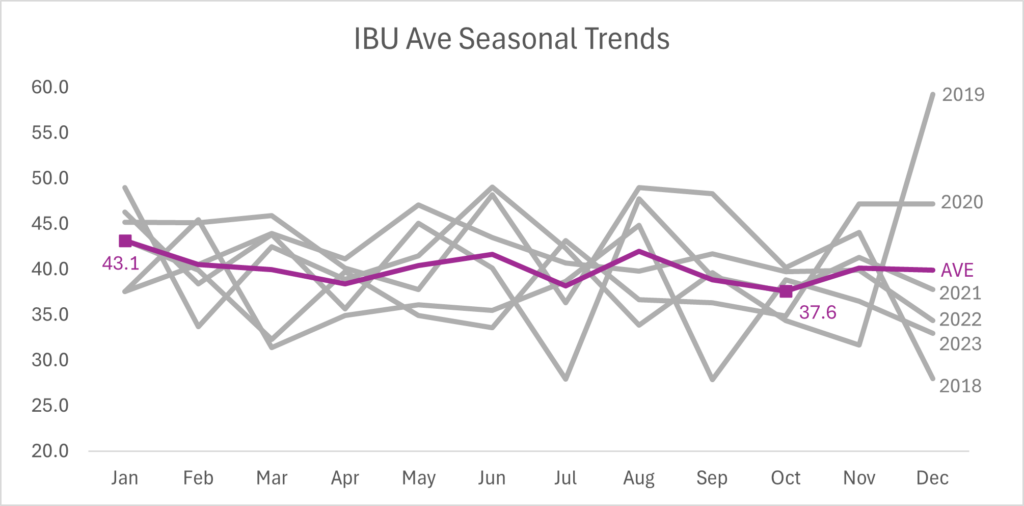
Average bitterness has trended steadily downward, falling from a monthly average high of 59.3 IBU in
December 2018 to a low of 32.3 IBU by the end of 2023. But note, this decrease is very small over 6
years, barely dropping an average of 1 IBU in 6 years.
The “steepest” drop is more recent, only occurring between 2022 and 2023, indicating
a shifting recipe preference away from higher bitterness, as seen below.
Seasonal Swings: Showcasing what we kinda already knew
ABV and IBU exhibit distinct seasonal behaviors. Higher ABV beers dominate late fall and early winter (peaking in November 2023 at 9.43%), while lighter beers rule summer (dipping to 5.55% in July 2021). Below you can find the lowest and highest monthly averages over all six years.
IBU, however, operates independently from ABVs, with small spikes in January and June, the lowest in October at 37.6 IBUs.
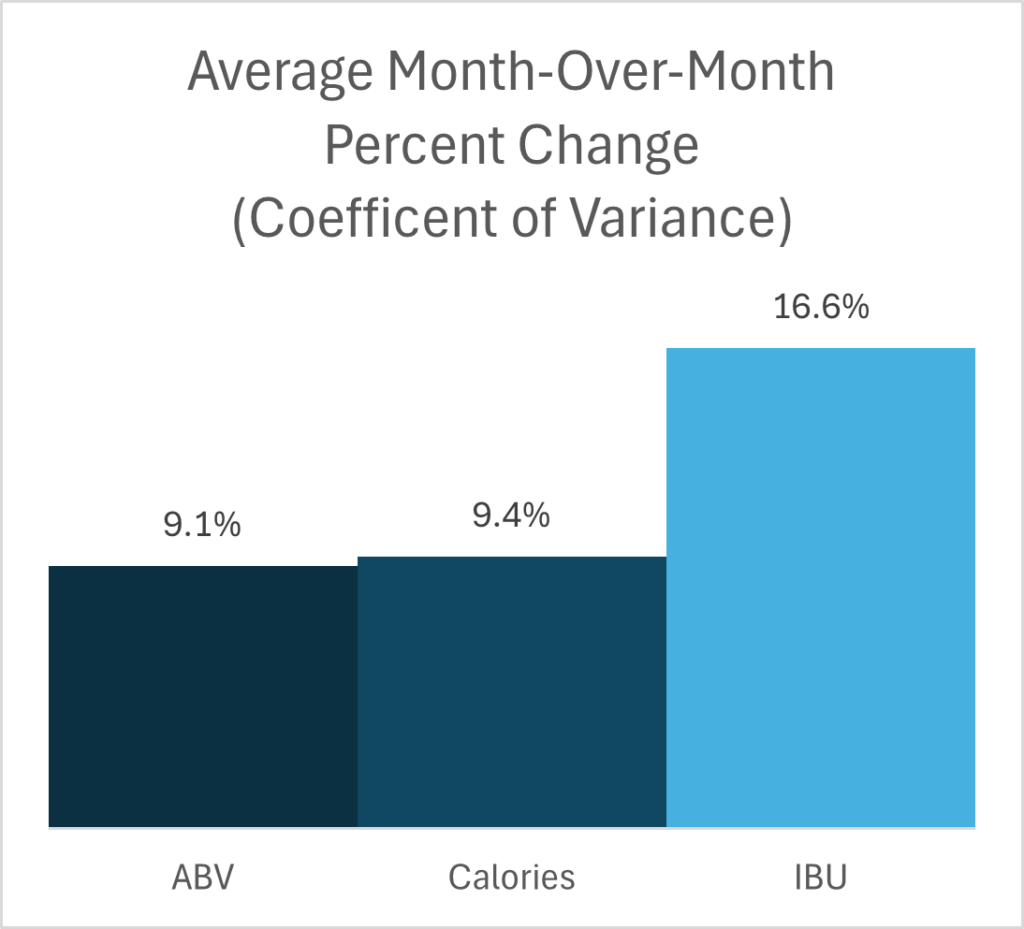
Monthly Changes: IBU Swings Larger
IBUs exhibited the highest month-over-month variance within the compiled data from January 2018 to December 2023, with a 16.6% average swing between months, compared to just over 9% for both ABV and Calories.
This analysis reveals a stark contrast between long-
term distribution and short-term behavior. While the
first IBU Graph showed IBUs remain tightly clustered
around a multi-year average, this sequential analysis
proves that IBUs experience the most drastic immediate, month-to-month swings. This suggests that while the market has a strict long-term average preference for
bitterness, individual monthly releases or seasonal
purchasing habits swing wildly in IBU levels compared
to a much more steady month-to-month baseline for alcohol and caloric content.
Craft Beer Trend Conclusions
1. How did the average ABV, Calories, and Bitterness change from January 2018 to December 2023?
ABV and Calories on average have increased. IBUs have very slightly decreased. ABV and IBU see seasonal trends: higher in the late year, lower in the new year, and a massive dip in July. Calories have increased the most over the 6-year period, despite being in a linear relationship with ABV.
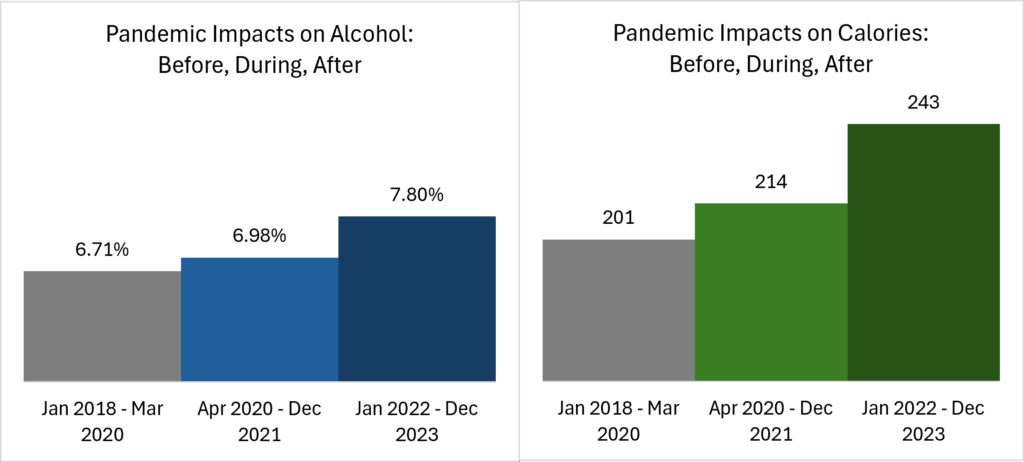
2. What is the impact of the 2020 Pandemic on ABV and Calorie content within the dataset?
In all Months, the Calorie averages were higher after the pandemic, with July still being the lowest. ABV average is increasing slightly over the 6-year period, with the largest increase happening after the pandemic in the 2022-2023 date range. Meaning after the pandemic, brewers began to increase caloric content in brews.
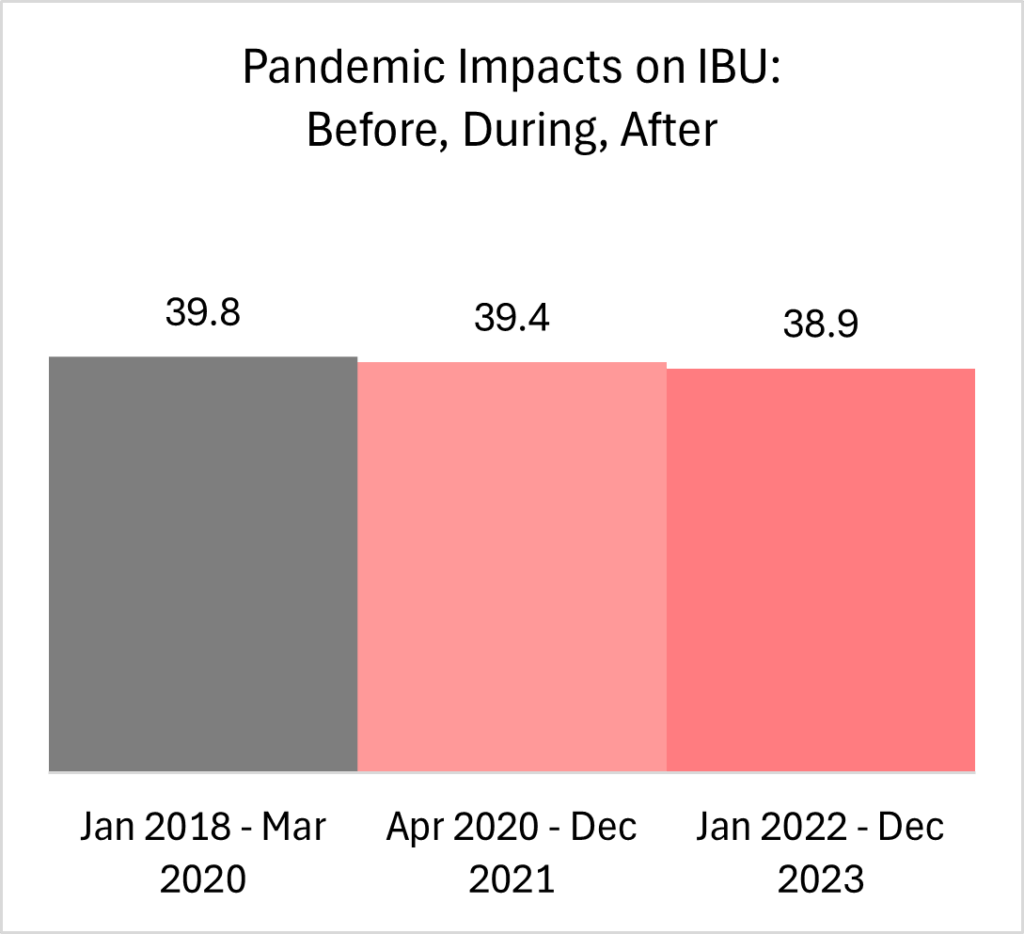
3. Did the average Bitterness (IBUs) in the dataset decrease from January 2018 to December 2023, and is there seasonality in IBU quantities during this timeframe?
IBU averages tend to remain around 40 over a 6-year trend, with just slightest trend downward. In 2022-2023 the trend downward exaggerates slightly.
4. Which of the three primary metrics (ABV, Calories, or IBUs) exhibited the highest month-over-month variance within the compiled data from January 2018 to December 2023?
IBU samples see the largest monthly swings, but remain relatively constant over a 6-year period, with a very minor downward trend. 2022-2023 saw the largest downward swing, implying a steeper downward trend to come.
Recommendations for Brewers
Nearly all sectors, including younger generations consistently show a preference for adjuncts and unique flavors. To capture this market while acknowledging broader health-conscious trends, brewers should consider the following:
Reduce Alcohol Content: Aim for lower ABV targets in new recipes to align with general consumer health trends.
Dial Back the Bitterness: With IBU averages steadily dropping, consider reducing bitterness where you can, including traditionally hoppy ones.
Innovate with Adjuncts: Focus on brewing low-calorie, low-ABV beers that utilize additional flavorings to deliver the robust profiles consumers expect without the caloric payload.
Thank you for reading my Capstone Project and Essay on Six Years of Craft Beer Trends. Please drop any questions or comments below. I’m curious what your thoughts are on the Analysis Trends vs Market Trends.
Cheers!
Very cool! Fun to see all the different trends shown so nicely.